


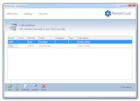
PetroVisual is a data analysis and visualization tool for oil and gas data. It connects to ARIES, PHDWin, OGRE and even your custom databases, allowing you to ask questions about your data and then analyze query results with a rich collection of maps, grids, charts, pivot tables, and drilldown trees. PetroVisual's benefits are immediate and compelling: Powerful. Ask questions about your data and receive quick answers. Use PetroVisual's portfolio of maps, graphs, pivot tables, and reports to build valuable insights. Build multiple views of the same data to drilldown, compare, and understand.
| Website | http://www.petrovisual.com |
| Revenue | $5.5 million |
| Employees | View employees |
| Address | 6907 N Trailway Cir, Parker, Colorado 80134, US |
| Phone | +1 303-885-2177 |
| Industry | Information Collection & Delivery, Media & Internet |
| Competitors | Halliburton, SLB, Baker Hughes, Weatherford, IHS Markit, Eagle Ford Shale, Oil & Gas Jobs by Rigzone, Oilon, Petrobras, Eni +44 more (view full list) |
| SIC | SIC Code 73 Companies, SIC Code 7375 Companies, SIC Code 737 Companies |
| NAICS | NAICS Code 51711 Companies, NAICS Code 5171 Companies, NAICS Code 517 Companies, NAICS Code 517110 Companies, NAICS Code 51 Companies |
Looking for a particular PetroVisual employee's phone or email?
PetroVisual Questions
The PetroVisual annual revenue was $5.5 million in 2026.
PetroVisual is based in Parker, Colorado.
The NAICS codes for PetroVisual are [51711, 5171, 517, 517110, 51].
The SIC codes for PetroVisual are [73, 7375, 737].


