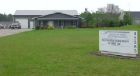
Environmental Dashboard project harnesses a novel technology and approach that reintroduces feedback at multiple scales to motivate and empower conservation, promote “systems thinking” and build “pro-environmental” identity. Specifically, Environmental Dashboard employs monitoring and display technology to provide three levels of ecofeedback: 1) Building Dashboard dynamically displays water and electricity consumption in individual buildings; 2) Citywide Dashboard animates whole community resource flows; and 3) Community Voices combines images and text to celebrate thought and action that advance sustainability in diverse communities.
| Website | http://environmentaldashboard.org |
| Revenue | $2 million |
| Employees | 5 (0 on RocketReach) |
| Address | 122 Elm Street, Oberlin, Ohio 44074, US |
| Technologies |
JavaScript
,
HTML
,
Google Analytics
+24 more
(view full list)
|
| Industry | Management Consulting, Business Services |
| Keywords | Systems Thinking, Environmental Conservation, Conservation Technology, Climate Action, Sustainability Solutions, Sustainability Metrics, Sustainability Dashboard, Environmental Protection, Green Technology, Environmental Monitoring, Environmental Impact, Environmental Software, Eco Innovation, Environmental Data, Eco Friendly Technology |
| Competitors | Schneider Electric, Enel X, Sierra Club, GreenSky®, Ecova, EnergyHub, ENERGYSTAR LIMITED, WattTime.org, Sense, Watershed +35 more (view full list) |
| SIC | SIC Code 89 Companies, SIC Code 899 Companies |
| NAICS | NAICS Code 54162 Companies, NAICS Code 5416 Companies, NAICS Code 541 Companies, NAICS Code 541620 Companies, NAICS Code 54 Companies |
Looking for a particular Environmental Dashboard employee's phone or email?
Environmental Dashboard Questions
The Environmental Dashboard annual revenue was $2 million in 2026.
Environmental Dashboard is based in Oberlin, Ohio.
The NAICS codes for Environmental Dashboard are [54162, 5416, 541, 541620, 54].
The SIC codes for Environmental Dashboard are [89, 899].
Related Companies